The true power of tomorrow’s AI-enabled construction
Join our open data challenge, SensatUrban
- We’re launching an open data product called SensatUrban and challenge you to develop algorithms and analytics that demonstrate accurate and scalable semantic segmentation of large scale urban point clouds and associated spatial data.
- Last year we did some AI research in collaboration with Oxford University where we developed an AI model to perform object segmentation on our dense and large-scale 3D point clouds.
- The idea is to take ‘dumb’ reality capture data sets consisting of millions of XYZ co-ordinate points and turn them into meaningful insights and patterns, similar to what we may recognise as a human.
At Sensat we love fun experiments, especially if it involves teaching machines to learn from our spatial data. We also love sharing our experiments with the industry so we can all learn together to solve the conundrums of 3D computer vision. Read on for data pain points, how and why computer vision will be a gamechanger for the construction industry, and how to take up our challenge using https://www.sensat.co.uk/
Is there ever such a thing as too much data?
These days there’s no shortage of construction-related data and volumes are rapidly growing. It’s often laborious to collect, difficult to store and even harder to know what to do with. Information for the civil infrastructure industry is about making a data connection with the real world and can come from sources as diverse as on-site workers, cranes, earthworks, material supply chains, and even buildings themselves. It’s not surprising then, that with such disparate data sets we found that 42% of civil infrastructure respondents we polled are struggling to use data in their organisations effectively.
According to FMI research, miscommunication and poor project data accounts for 48% of all rework, costing the construction industry over $31 billion per year, alongside the time spent on non-optimal activities such as fixing mistakes, looking for project data and managing conflict resolution, which accounts for $177.5 billion in labour costs per year in the U.S. alone. This means that unstructured data is not only hard to manage, but it’s also costing us a lot of money.
Why can’t I find my data?
If the sheer volume of data at our fingertips is the first obstacle, then quality is the second; because as we know quantity rarely equals quality. One of the biggest barriers to harnessing data in civil infrastructure is that most of the data sets are sitting in software silos somewhere, which are not accessible in one particular place. Aside from the fact that information is sitting in different repositories and on varying proprietary software, some is not always in digital or computer understandable formats. This makes things more than a little difficult for us to analyse a holistic environment. The good news is that once all of these data sets are represented in one single platform you can begin to master a huge, powerful environment where you can actually visualise all your site data in one place. We are seeing customers overcoming data pain points and making huge productivity gains by easily accessing and visualising accurate and up-to-date 3D models of their sites.
Once the data can be visualised in a common visualisation environment, we can start to execute on our vision to make computers understand the real world. However, before we leap ahead to introduce spatial context to algorithms, it is essential that these algorithms understand the composition of the physical surroundings.
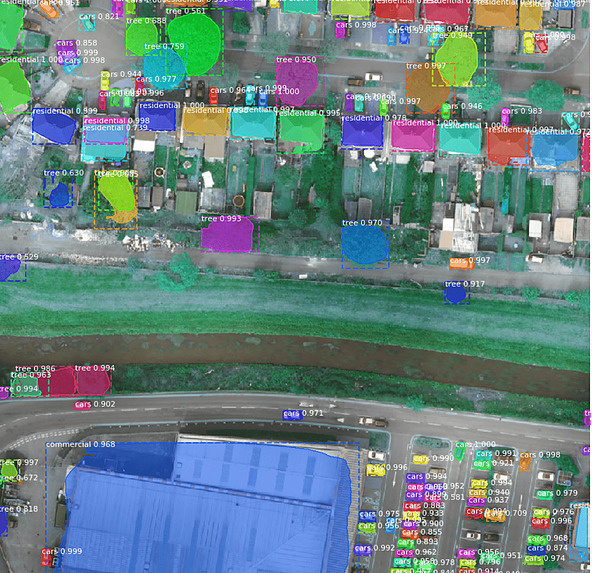
Annotated data showing residential and commercial buildings; roads, trees, fields and cars in Sensat’s visualisation platform.
How computer vision will be a gamechanger for the construction industry
What we’re really excited about is the idea that computers can learn to understand the real world in the same way that humans do, e.g. they’re able to recognise an object like a tree or a car and can look at an image and know the composition of it. After the algorithms have the ability to recognise entities in the image, the next stage is to make sense of the relationships an object has with another object sharing the same environment. For example, if there’s a tree appearing inside a park, then there must be a relationship; If a tree is appearing next to a house there must be an effect caused by that tree on the structural foundation of the house and vice versa; and if a tree is appearing in the vicinity of a railway track, this might cause a potential problem by encroaching onto the track causing potential delays and even damage to the train. Identification of these spatial relationships is essential so that appropriate maintenance operations can be performed in order to avoid disruption.
The objective of any computer vision project is to develop an algorithm that detects objects. But detection alone is not always enough—it must also be accurate and trustworthy to be most useful. We can say that object recognition comes in many forms: good, better and best. Here are a few common types and their application in the construction industry…
Good: Classification
The simplest and most researched topic in computer vision is ‘Classification’, which uses simple neural networks to create classifiers that can tell a computer if an image consists of an object or not, like the tree and car example I mentioned above. These classifiers are quite naive and they don’t know exactly where the car or tree is in the picture or how many there are—the computer only knows that there’s a car or tree in there somewhere.
At Sensat, we have developed a land cover classifier that uses high-resolution UAV (unmanned aerial vehicle) captured orthomosaics and identifies a known set of land cover available in the image. Orthomosaics images can be very large in size, hence we chop them into smaller grids. The cells in these grids are called tiles and are as small as 256 px by 256 px. The tiles can be generated at different levels of detail—depending on the size of the objects classified in the results—for example, an image can be gridded in 200m by 200m tiles to capture classes such as fields and road, while the same image can be gridded in 10m by 10m tiles to classify buildings and trees. The classifier then identifies if a tile belongs to a building, or if a tile belongs to a road, or a tree, etc. Now, if that tile is partially ground and partially tree, the classifier will have to make a decision which one to choose, based on the dominant class. But what is great about this simple algorithm is when you put all the classified tiles together, it suddenly appears to provide an overall spatial reconstruction of your environment—just like a jigsaw puzzle.
💡 Such environmental patterns can be very useful in the architecture, engineering and construction (AEC) industry, especially during the ‘Environmental Impact Assessment’ stages. Understanding current land cover patterns—and accurate means of monitoring its change over time—is key knowledge for any organisation responsible for land management and planning. Automated land cover categorisation can be beneficial to a range of organisations such as local authorities managing land, environment agencies assessing the dynamic nature of landscape evolution and its effects on flood management, and engineering firms planning a large national infrastructure project.
Better: Semantic segmentation
Semantic segmentation takes object detection a step further where a computer is not only able to simply recognise an object’s class in your image, e.g. this image is of a car, but it will actually draw a boundary around the car. However, despite the computer being able to recognise an object in the image, it does not know how many objects of the same class exist in the image. While image classification gives us a high-level indication of patterns within our image, image segmentation creates a pixel-level mask of each object in the image. Every pixel in an image is labelled as one object or another. Results of image segmentation can help automatically delineate boundaries of objects of interest such as bodies of water, roads, crop fields, stockpiles, heavy machinery and even building material placed in a construction site.
💡 Object segmentation algorithms can be used on 2D images or they can also be used to identify locations of objects in a 3D point cloud. Although adding an extra dimension to object detection increases the complexity of the algorithms, it also increases the potential of applications. From simply identifying boundaries of the objects in images, true volumetric calculations can be performed when objects are segmented in point clouds. An application of this could be the automated volume calculation of stockpiles in a construction site for example. In this case, the algorithm won’t just know where the stockpiles are, but it’s able to calculate the volume of the stockpile, and with repetitive UAV surveys, a holistic progress monitoring application can be fully automated. Similarly, by using an existing network of CCTV cameras it’s possible to measure the quantity of building material residing on-site—monitoring logistics and notifying managers in advance when more material needs to be ordered.
Best: Instance segmentation
Instance segmentation is one of the hardest challenges in computer vision, especially in 3D point clouds. Consider ‘instance segmentation’ as a refined version of semantic segmentation so that not only can the computer recognise an object such as a car, but the same algorithm can tell you how many individual cars are there in the image and their exact location—instance segmentation detects the instances of each classified object.
Once the algorithms know the composition of the digital replicas that mirror the physical world, how many objects there are in that digital environment and where they are in relation to other objects, we can begin to unlock meaningful insights and patterns—similar to what we may recognise as a human. This, taken a step further, opens up predictive abilities, whereby we can monitor change over time to make better decisions and implement warning systems.
💡 These systems can range from AI monitoring the progress of a project and predicting their success or failure. Automated monitoring of key infrastructure assets such as railway tracks can provide warning systems that can create proactive maintenance workflows. For example, if railway tracks need to be maintained from vegetation encroachment, real-time, high-quality aerial images and point clouds accessible in a visualisation platform, able to process large amounts of data sets, will enable teams to proactively clear the tracks before an accident occurs—without risking the health and safety of a traditional surveyor on the tracks collecting data manually. Real-time monitoring of hazard build up on reservoirs and dams can identify their potential failure, proactively avoiding the damage and possible floods.
Today, if someone digs a hole on a construction site and it rains, the hole gets flooded and work has to stop for a few days until someone secures a pump to remove the water. If we can combine semantic and instance segmentation from our physical data sets with predictive weather analytics, for example, this could be huge for areas in flood prevention and disaster relief.
Where we are now
If our computers can’t quite yet predict the future, we’re at least getting to the stage where AI and machine learning can be realistically used for assessing past and current projects. If something has gone wrong in the past, we can use historic data sets in our platform to go back and see what might have caused it so that we can make better decisions next time. Eventually, we can train our AI and machine learning algorithms to warn us, if there is a chance of it happening again. While we might be some way off achieving true intelligence in our algorithm in the near future, one thing that modern AI excels in already is automation. The current algorithms are fantastic at recognising repeatable patterns in data and monitoring those patterns over time to automate a process.
At Sensat, while we endeavour to teach our algorithms the true understanding of space and time, the computer vision industry faces a huge challenge of dealing with large scale 3D point cloud data. Current algorithms, albeit very efficient at processing small-scale data sets, fail to perform object segmentation on large-scale urban point clouds. An essential prerequisite for unleashing the potential of supervised deep learning algorithms in the area of 3D scene understanding is the availability of large-scale and richly annotated data sets. However, publicly available data sets are either in relatively small spatial scales or have limited semantic annotations due to the expensive cost of data acquisition and data annotation, which severely limits the development of fine-grained semantic understanding in the context of 3D point clouds.
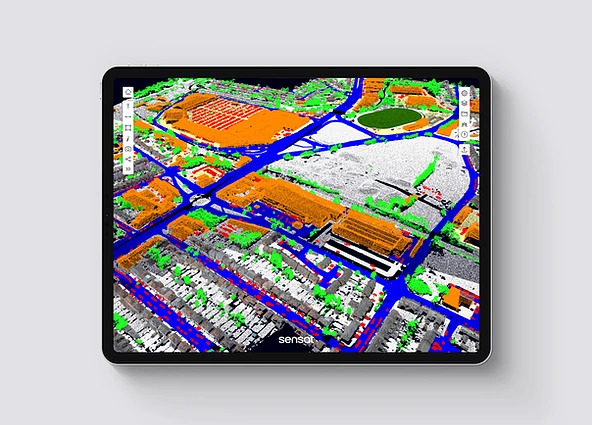
Object segmentation in Sensat’s visualisation platform
Take our challenge
So far we’ve had great success developing an AI model to perform object segmentation on our dense and large-scale 3D point clouds with Oxford University, but we think we can improve these algorithms even more if we bring the computer vision industry together.
In order to accelerate the development of these AI algorithms, within the computer vision and deep learning community, Sensat will soon be launching an open data product called SensatUrban, under a Creative Commons license.
This data set is an urban-scale photogrammetric point cloud data set with nearly three billion richly annotated points, which is five times the number of labelled points than the existing largest point cloud data set. Our data set consists of large areas from two UK cities, covering about 6 km^2 of the city landscape. In the data set, each 3D point is labelled as one of 13 semantic classes, such as ground, vegetation, car, etc. In addition to the annotated point clouds, we also plan to release the 2.5cm spatial resolution orthomosaics and digital surface models.
We need our algorithms to be accurate, trustworthy and fast, but most importantly intelligent enough to adapt to new data. Sensat has a shared industry vision to build AI that demonstrates geospatial cognition and contextual understanding of the physical environment. We also strongly believe that releasing SensatUrban as Open data will bring a diversity of innovation in achieving this hugely challenging vision.
The main objective of this challenge, if you wish to accept it, is to develop algorithms and analytics that demonstrate accurate and scalable semantic segmentation of large scale urban point clouds and associated spatial data. However, if you have innovative and ambitious use cases particularly in the civil infrastructure industry, we are extremely keen to hear from you.
Sensat are about to release this unique data set into the open world and we know you are all going to love it. Register your interest at [email protected] to take up our challenge!
You can read all insights from techUK's AI Week here