Measuring the carbon impact of your data

Author: Luke Sharma, Senior Data Consultant, The Oakland Group
We live in a hugely digitised world where data processes and data centres are integral to running a modern business. However, it’s sobering to consider that technology may come at an unforeseen cost. A cost not just measured in pounds but our planet's health. By 2030, it is projected that data processes and data centres will contribute an astounding 8% of global greenhouse gas emissions eclipsing the aviation industry.
This undeniable reality forces us into a pivotal moment where we can’t overlook the environmental impact caused by technology.
But, there is a glimmer of hope – a chance to take decisive action and pave the way to a more sustainable future with every individual and business able to take a small step towards driving change
For businesses navigating a sea of compliance and accountability, the call to action is clear, but how do we bridge the gap between ambition and implementation in a way that’s both impactful and cost-effective?
What are the current ESG reporting measures?
At the moment mandatory reporting is restricted to Scope 1 and Scope 2 emissions. Just as a quick reminder;
Scope 1 emissions are emissions that your business directly produces (e.g., company vehicles)
Scope 2 emissions are those that are produced from purchased energy (i.e., the numbers that you see on your electricity bill)
Scope 3 emissions are those produced from your upstream and downstream supply chain (e.g., emissions associated with outsourced IT services).
So why does measuring the Carbon Impact of my data make a difference?
If your business has an on-premises data infrastructure this should start to ring some alarm bells.
Think about all of the utilities that you need to maintain an on-premises data centre. Powering servers is the highest energy user – but server energy usage on its own has potential for improvement. Server config and distribution of workloads can often drive higher than necessary power usage. For example, the average server is at approximately 18% utilisation at any time. Given the linear nature of power usage vs utilisation, you can triple the existing “utilisation” of that server (making it 54% utilised), whilst only using around 50% more energy (Server power consumption versus utilisation. | Download Scientific Diagram (researchgate.net)). That means you are getting a 300% increase in productivity for just a 50% increase in energy usage. Think about the carbon impact of this change and the cost savings that can be attached to your energy bills! With today’s energy prices, this is well worth investigating.
Since heat and electrical components do not mix, it is no shock that a chunk of power consumption comes from cooling. This is calculated in power usage effectiveness (PUE), where you calculate the efficiency of data centres based on how much energy is used to power servers versus other energy uses. The average PUE of an on-premises data centre is 1.55 – so for every 1kwh of energy used to power servers, 0.55kwh is used for other services (Data center average annual PUE worldwide 2022 | Statista).
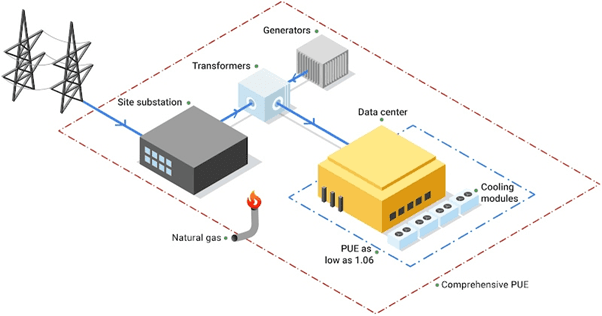
Figure 1A typical datacenter layout, with energy consumption driven by powering servers and cooling modules (Efficiency – Data Centers – Google)
For example, if you were hosting an international organisation’s data infrastructure on a private cloud, at a minimum, you would need a server room with a cooling unit and a set of servers that need to be powered 24/7.
Imagine the volume of energy required to power even just a small room of servers – if you have your data stored on-premises, the Scope 2 emissions for your data alone will make sobering reading!
But I do a lot of data processing in the cloud, I don't need to report that, do I?
This is a difficult topic to broach because it is not official yet – but all indicators are heading towards Scope 3 emissions becoming mandatory soon.
This will include supply chain processes up and downstream, including your cloud estate, and understanding the carbon emissions produced by your cloud infrastructure. Aside from the regulatory reasons for reporting your cloud emissions, it is also worth noting that there are huge benefits to making your cloud more efficient from both a carbon and a cost perspective. This is simple to explain: if you lower your cloud computing intensity and volume, your energy usage will drop alongside carbon emissions and the associated costs of the resources you use!
Reporting and understanding these emissions are a slightly different beast – the dashboards provided by major cloud providers are adequate, but there are some latency and transparency issues that make it difficult to immediately understand and report on your Scope 3 emissions. You need to add a lot of assumptions into the figure provided by cloud providers to come to a more accurate number (e.g., replication factors).
This can be a critical vein of opportunity for your organisation to lower carbon emissions, given the estimates that Scope 3 emissions account for an estimated 90% of total emissions.
What do I need to do to target these emissions?
We see a real positive impact from organisations attempting to lower their Scope 2 emissions through a variety of wide-reaching activities like installing energy-efficient lights, LED bulbs, lowering heating, etc. From a data perspective, some are kicking the can down the road by migrating data to the cloud – but let us think about how we can use a data-driven approach to lowering your data’s emissions with far greater precision.
We need to think about practical steps to drive important action.
As an example, let us use the concept of dark data. If you are unfamiliar with this topic, most data generated worldwide is considered “dark data” (circa 55%) - meaning it is not used or has any future uses. However, storing and processing this data still consumes vast amounts of energy. If you could understand and identify where this dark data sits in your data platforms and either consolidate it in on-premises servers (think back to that 300% efficiency saving…) or even delete it, you can actively lower carbon emissions in a reportable way without impacting business processes.
You can only make and report these actionable drops in carbon emissions by having baseline reporting in place, understanding your current emissions, and taking remedial action to lower those emissions.
If you’d like to learn more about how you can make a meaningful impact on your organisation's carbon footprint, unlocking the cost-saving potential within your data operation, contact us today.